Monitor the Performance of your Heroku Rails App with New Relic

Install the New Relic Heroku addon
Install the New Relic Heroku addon for your application like so:
heroku addons:create newrelic:wayneHere we use the free plan, wayne. Other plans are shown here. Careful, some of the larger plans aren’t cheap!
Install the New Relic agent
Now, install the New Relic agent, that is, simply install the gems and bundle.
gem 'newrelic_rpm'Commit your changes and push to production.
Configure the New Relic agent
A lot of the configuration work is taken care of by the Heroku addon. All we must do is give New Relic a name to call our app. This step is not optional. Provide the name like so, replacing Your Application Name with whatever you wish your app to be named in New Relic:
heroku config:set NEW_RELIC_APP_NAME='Your Application Name'Generate Traffic and View Application Performance
Generate some traffic to your site (this can be automated, or be done by simply clicking through the site manually).
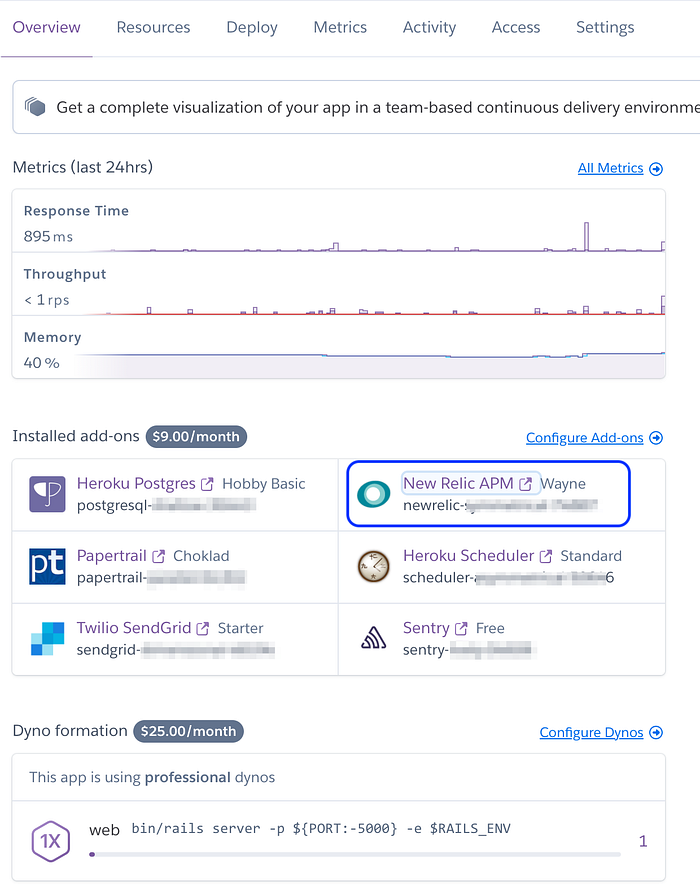
Now visit the Heroku dashboard, select your application, and under the ‘Overview’ tab, look for the New Relic APM link:

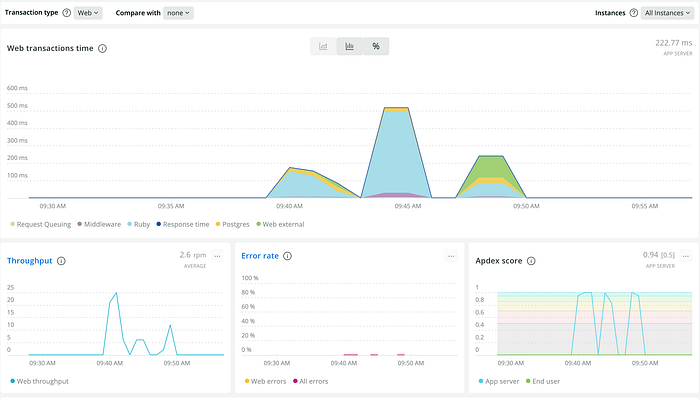
You’ll be taken to the New Relic home screen. From here, simply click on the application you named in a previous step, and you’ll be taken through to your app’s dashboard:

You can view throughput, transactions time, error rates, the top 5 slowest transactions, and many more useful and detailed metrics, including response times, CPU utilization, and memory usage on a per process basis — extremely useful for gaining visibility of how your Heroku app is consuming these resources.
Congratulations, you’re now able to monitor the performance of your ruby on rails application with ease!
